 User-Interface Features

- appearance of the UI is configurable at runtime.
- support of UI themes (dark, light, …), accent color, large and small fonts.
Audit-Trail Features
 system audit trail
 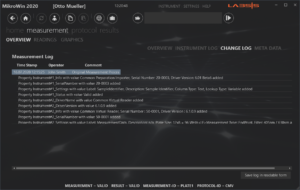 provides information about the usage of the software (records all user activities performed with the application).
- measurement audit trail records all actions concerning data recording and manipulation. This audit trail is part of the measurement data file.
- protocol audit trail records all actions used to create or modify the protocol. This audit trail is part of the assay file.


Login Features

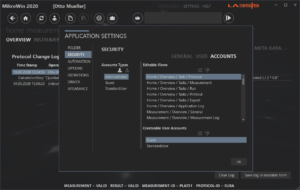 database based login-system (centric user database for multiple workstations)
- user account management in combination with the operating system to prevent double login.
- support of individual access levels assigned to each user.


Measurement Features
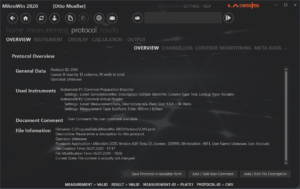
 measurements (experiments) are stored using a property data file and can thus be easily exchanged. Measurement files are encrypted and could only be edited by this application.
- a measurement files contains all measurement values recorded by the instruments and transmitted via the instrument drivers. There are also drivers that import measurement data or metadata from different sources (text file / database). All rack based data is stored as a label. Each label has a specific data format (endpoint, repeat, scanning, spectra, 2D / 3D data). A measurement can contain of multiple labels with different formats.
- a measurement file contains metadata (operator, instrument-ID, …) describing the conditions used to perform the measurement.
- measurements contains their own history, so if data was changed, all changes are traceable.

Protocol Features
 protocols are stored in the form of a file and can thus be easily exchanged. Protocol files are encrypted and could only be edited by this application.
- protocols contain their own history, all changes are traceable.
- a protocols is able to monitor controls over a longer period of time. If a control is marked for monitoring, the value of the control is stored in the assay after each measurement and thus a control history is established.
- a protocols is able to transfer controls and standard curves for reuse in future measurements. The corresponding values are stored as metadata in the measurement file. Later, these metadata can be transmitted automatically (during measurement start) or manually (individually after the measurement) for reuse with the appropriate measurements.

Protocol Components

 instrument(s) to use; maintains a list of instrument drivers and associated instrument settings. In this case, instrument(s) are not only purely physical devices, but also drivers that import additional data like sample identifiers or dilution factors.
- rack overlay; a graphical representation of the rack (plate) allows the user to assign a meaning (e.g. control, standard, sample, …) to each position of the rack. In addition, it is possible to assign different tests (using different calculation options, e.g. different thresholds) ) to different areas of the rack.
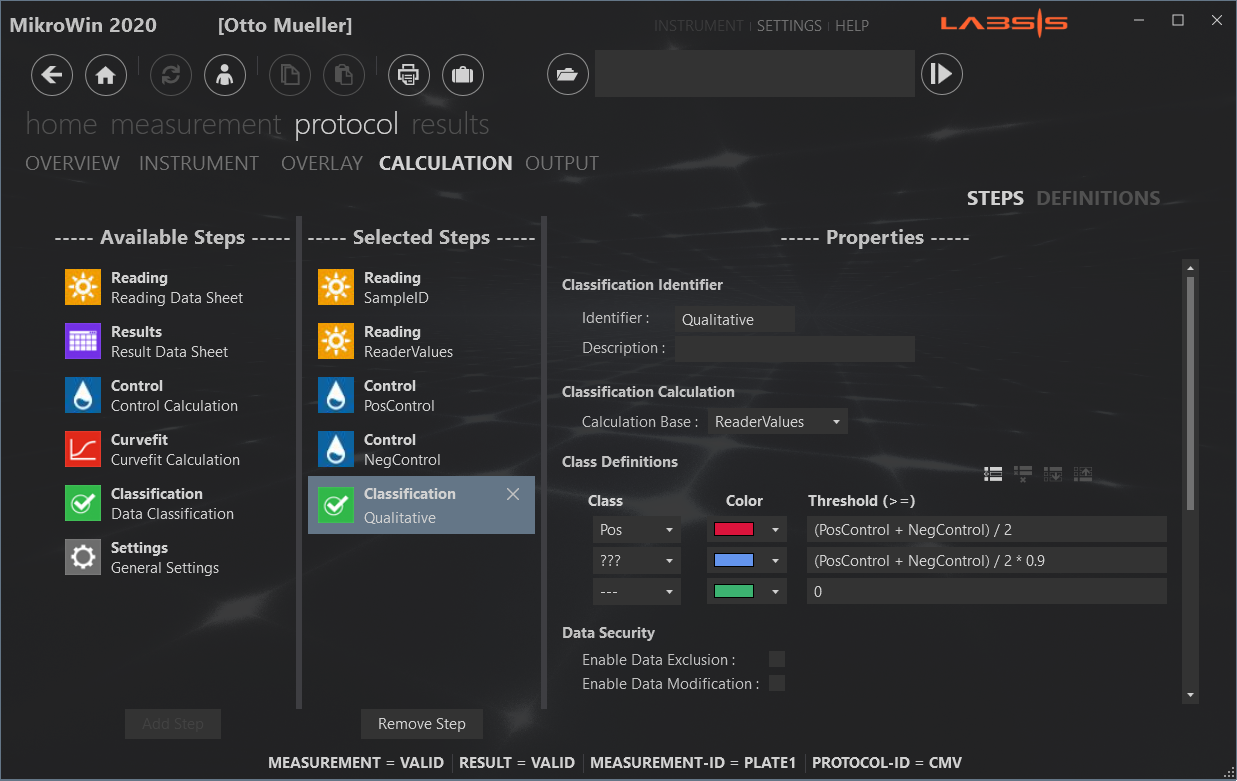
- list of calculation steps; a list of calculation steps can be constructed by any combination of the five available predefined calculation steps (Reading, Result Sheet, Control, Curvefit, Classification). Each step is assigned to step specific settings that are easily accessible by the user.
- export settings; the application supports three different output destinations (printout, export, screen). For each output destination, the compilation of the output is controlled by a list. Different output options (Label Data, Sheet Data, Custom Data, Statistics Data Document Overview, Graphics View) are offered depending on the output destination.

Result Features
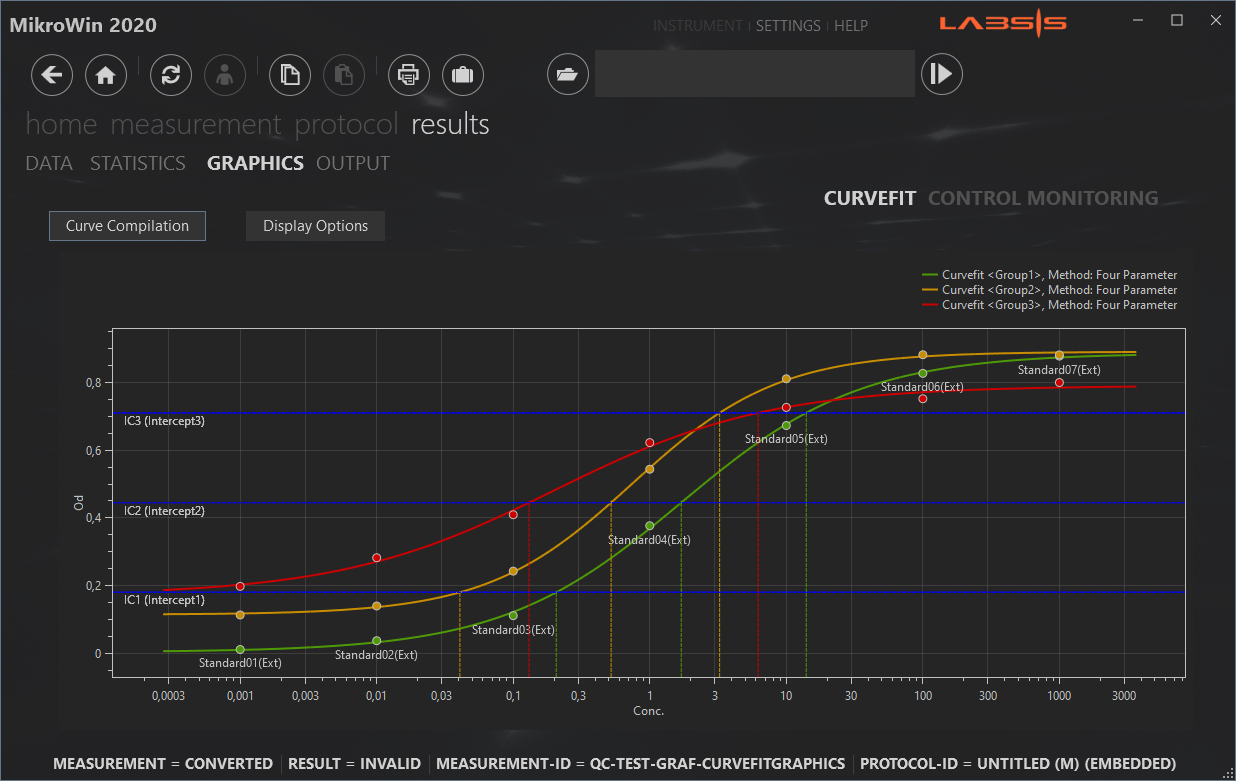
 results are calculated
 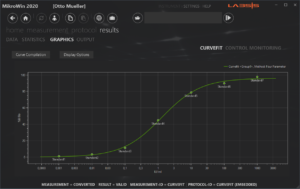 online based on the currently loaded measurement data and protocol. Any change in the measurement data and / or protocol settings leads to a new calculation of results. New measurement values that are permanently added during an ongoing measurement also lead to corresponding updating of the results.
- result presentation is divided into four areas (data, statistics, graphics, output). The data view shows all rack-based results in rack or list format. Number and order of the values are determined by appropriate assay settings. The statistics view displays corresponding statistics data according to the selected calculation options (controls, classification, curvefit, validation). The graphics view is used to present curve plots based on the selected calculation options (control monitoring, curvefit). The output view is divided into three sub-areas ( printout, export, screen) according to the equivalent assay settings. The appropriate settings defined in the protocol is used to generate corresponding presentations of results according to the output target.

